
AI




If you are reading this, you have already heard the pitch. AI takeoff saves 70% on takeoff time. Great. The question that actually matters when you are the one signing off on a bid is narrower than that: which 70%, of which step, on which kind of project?
Table of Сontents
Electrical estimating is not one task. It is nine distinct steps, run in order, from the moment a PDF set lands in your inbox to the moment clean quantities hit your estimating system. Each step has its own cycle time and its own ceiling on what software can change. Automation tears hours out of a couple of them, trims a few more at the margins, and barely touches the rest.
What follows walks all nine in the order you run them on a real bid. For each, you get a directional manual time range, a plain read on what automated takeoff actually changes, which tools move that step, and a rough savings estimate you should verify on your own drawings. Scope here is commercial and industrial work: think 50-plus devices per sheet, 5 to 20 sheet sets, retail through healthcare and light industrial. No residential.
Before the detail, here is the whole sequence in one breath, one line each:
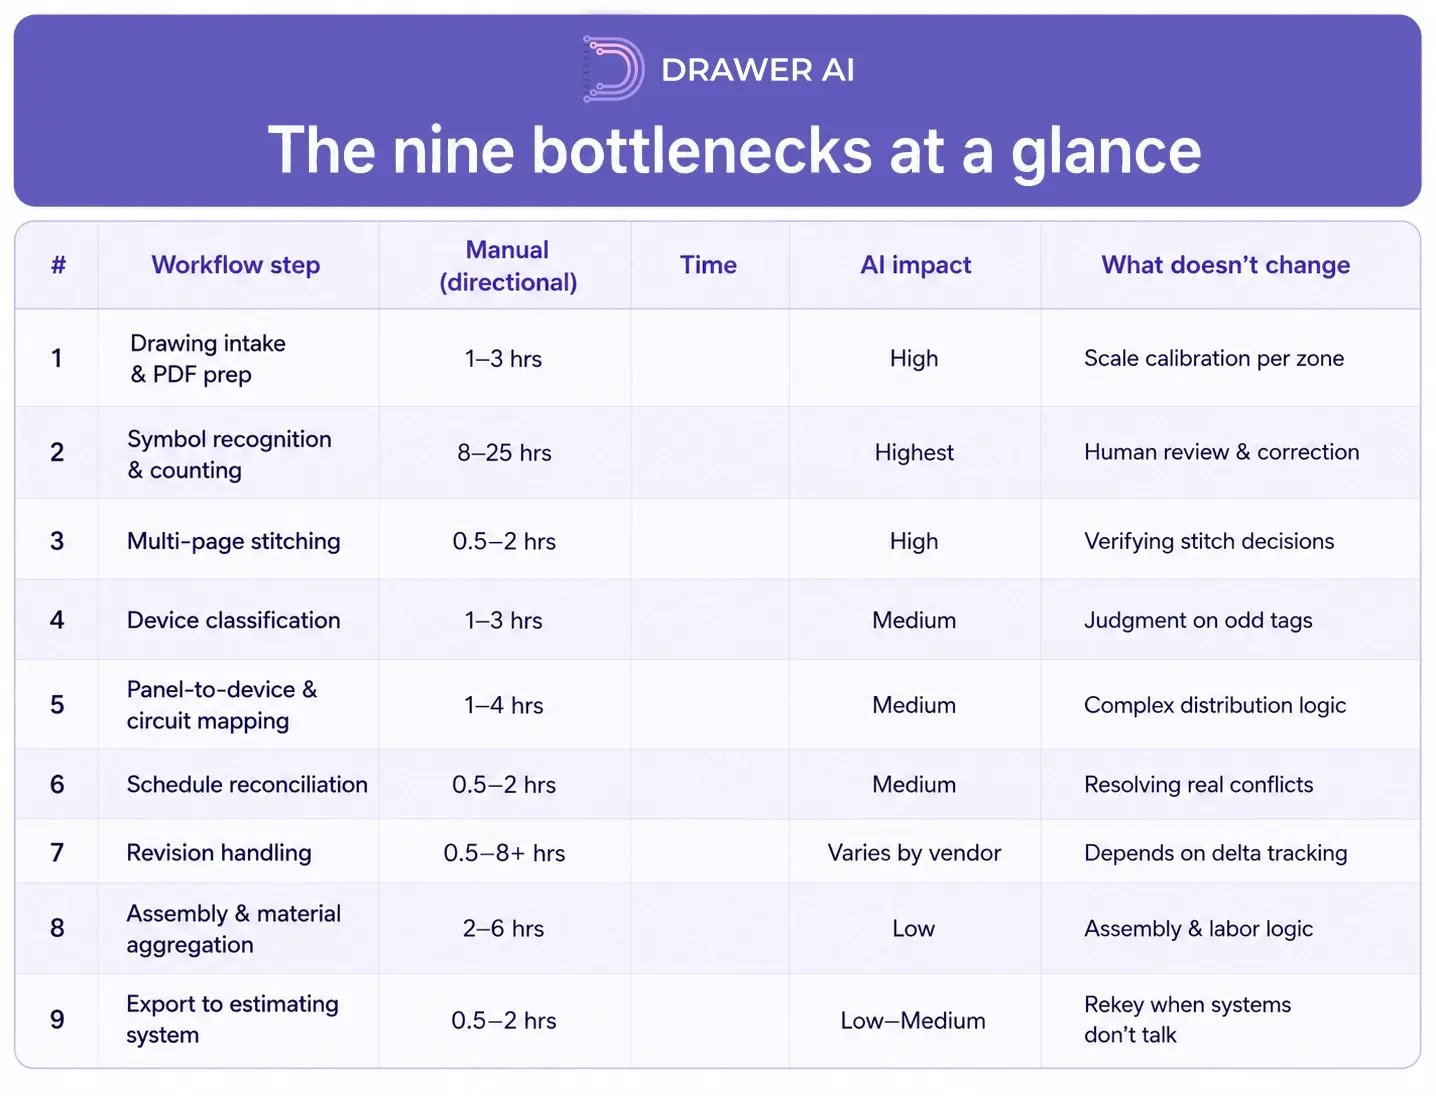
Two things worth flagging up front. Steps 2 and 3 together usually eat the biggest slice of estimator hours on a device-dense commercial bid. Steps 8 and 9 are where automation does the least. Throughout, the anchor data point is the Starr Electric cancer-center case — the one Drawer AI deployment with a public step-by-step breakdown — so it earns more weight than any directional estimate.
|
# |
Workflow Step |
Manual Time (Directional) |
AI Impact |
What Doesn't Change |
|
1 |
Drawing intake & PDF prep |
1–3 hrs |
High |
Scale calibration per zone |
|
2 |
Symbol recognition & counting |
8–25 hrs |
Highest |
Human review & correction |
|
3 |
Multi-page stitching |
0.5–2 hrs |
High |
Verifying stitch decisions |
|
4 |
Device classification |
1–3 hrs |
Medium |
Judgment on odd tags |
|
5 |
Panel-to-device & circuit mapping |
1–4 hrs |
Medium |
Complex distribution logic |
|
6 |
Schedule reconciliation |
0.5–2 hrs |
Medium |
Resolving real conflicts |
|
7 |
Revision handling |
0.5–8+ hrs |
Varies by vendor |
Depends on delta tracking |
|
8 |
Assembly & material aggregation |
2–6 hrs |
Low |
Assembly & labor logic |
|
9 |
Export to estimating system |
0.5–2 hrs |
Low–Medium |
Rekey when systems don't talk |
What it is. You receive the drawing set, separate scope sheets from schedule and detail sheets, build a sheet index, calibrate scales, and set up the takeoff template. Nothing glamorous, but skip a sheet here and it haunts the whole bid.
Manual cycle time. Roughly 1 to 3 hours. Under-10-sheet jobs sit at the low end; sprawling healthcare and industrial sets run high.
What automation changes. AI tools auto-merge sheets, parse legends, and pre-build the layout, so your setup collapses into a short review. Drawer AI's automated stitching assembles multiple PDF sheets into one unified floor layout using column grids, and on the Starr set it also separated PDFs into drawings, named them from title-block data, and pulled schedule data automatically. Scale calibration per zone is usually still a manual touch.
Tool fit. AI-native takeoff tools lead on auto-setup. Legacy suites such as McCormick and Trimble Accubid require manual sheet setup before counting begins. PlanSwift sits in between. Countfire handles lightweight intake for simpler sets.
Directional savings. Roughly 60 to 80% on this step when AI auto-setup is used and reviewed. Verify on your own drawings.
What it is. Identify and count every device (fixtures, receptacles, switches, data drops, fire alarm, panels, equipment) across every sheet.
Manual cycle time. Roughly 8 to 25 hours on commercial sets. This one scales linearly with device count and is capped by how fast a human can click, sheet after sheet, without missing anything.
Why it is the single biggest bottleneck. There is no shortcut in manual counting. More devices means more hours, full stop, and fatigue only makes the error rate climb.
What automation changes. This is where AI delivers its largest verified saving. On the Starr cancer-center set (3,284 fixture symbols and 3,361 receptacles), Drawer AI's detection cut symbol takeoff time by 76.1% overall — 81.1% on fixture symbols and 71.5% on receptacles — with the estimator reviewing and correcting on the Takeoff Pad. That is 5 hours 29 minutes against a manual baseline of 22 hours 55 minutes. Worth being precise: this is a takeoff-step saving, detection plus QA, not a full-bid-cycle number. See the full breakdown at drawer.ai/resources/starr-case-study. Note the figures there (3,284 / 3,361 / 76.1%) run higher than the homepage rounding of 2,600-plus fixtures and 70%; use the case-study breakdown.
Tool fit. AI-native takeoff tools lead on symbol recognition. Countfire automates counting of trained symbols but not full electrical-context recognition. PlanSwift stays manual. Legacy suites rely on manual takeoff feeding downstream pricing.
Directional savings. 50 to 75% directional; Starr verified at 71 to 81% by symbol type. Verify on your own drawings.
What does not change. Your review-and-correct time. AI counts faster; the correction pass is still human-paced, and on receptacle-heavy floors QA was actually the larger share of the clock.
What it is. Track devices across match lines, key plans, and continuation sheets so edge devices get counted once, never twice, and never dropped.
Manual cycle time. Roughly 30 minutes to 2 hours, worst on sets with 8-plus floor-plan sheets stitched by match lines.
What automation changes. AI tools with native stitching consolidate counts automatically. Drawer AI's stitching merges sheets into a unified layout using column grids, so your review focuses on verifying stitch decisions rather than doing the stitching by hand. On the Starr set, a 7-page Level 2 lighting stitch went through cleanly in a few minutes.
Tool fit. AI-native takeoff tools with native stitching lead on this step. Manual tools like PlanSwift and legacy estimating suites put the stitching work on the estimator.
Directional savings. 50 to 80% when stitching is automated. Verify on your own drawings.
What it is. Assign each counted device to its correct type — Type A vs Type B fixture, normal vs emergency power, voltage class, circuit type — using the fixture and device schedules as the source of truth.
Manual cycle time. Roughly 1 to 3 hours, driven by fixture-type diversity. Four types is quick; twenty-five is a slog.
What automation changes. Tools that read fixture schedules and cross-reference symbols pre-assign the classification. On Starr, extracted fixture-schedule data informed detection, and Smart Grouping by item class and type sped the scan-and-correct pass for mis-tagged names. You validate instead of executing.
Tool fit. AI-native takeoff tools lead where classification is tied to automated schedule reading. Legacy suites handle classification through assemblies — a different mechanism with a similar end result for the estimator, but requiring device counts to be entered first.
Directional savings. 40 to 60% directional. Verify on your own drawings.
What it is. Associate each device with its feeding panel and circuit — required for feeder lengths, branch counts, and downstream conduit fill.
Manual cycle time. Roughly 1 to 4 hours, highest on sets with many panels and complex distribution.
What automation changes. Tools that read panel schedules pre-build the panel-to-device map. Drawer AI extracts panel-schedule data (used on Starr to drive wire sizing) and provides circuit grouping and branch routing with automated wire sizing, voltage-drop calculation, and derating. On the Starr project, that circuit view also surfaced discrepancies between the panel schedule and the floor plan before construction began.
Tool fit. AI takeoff tools with panel-schedule extraction lead on this step. Manual workflows and most legacy estimating suites require explicit, estimator-driven panel association.
Directional savings. 30 to 60% directional. Verify on your own drawings.
What it is. Cross-check device counts against the project's fixture, panel, and equipment schedules. A mismatch means either a missed device or a schedule error — and either way you want to catch it before the bid goes out.
Manual cycle time. Roughly 30 minutes to 2 hours.
What automation changes. Tools that extract schedules in structured form can surface the deltas for you through built-in QA tools, instead of you building a side-by-side comparison spreadsheet by hand. The judgment on what a real conflict means still sits with you.
Tool fit. AI takeoff tools with integrated schedule extraction and QA capabilities lead on this step. Spreadsheet-driven manual reconciliation — comparing a printed schedule against a hand-counted takeoff — is the common alternative in shops without AI tools.
Directional savings. 40 to 60% directional. Verify on your own drawings.
What it is. When a revision lands mid-bid, propagate additions, removals, and relocations through the takeoff without restarting from scratch.
Manual cycle time. High variance: 30 minutes to 8-plus hours per revision, depending on scope and tool. Tools without delta-tracking often force a full re-run.
What automation changes. This step swings more than any other, and capability differs sharply between vendors. Drawer AI does not publish an automated revision-delta feature on its pricing or feature pages. The honest move on this step is to verify each shortlisted vendor's revision handling specifically — on a real revision, not a demo — because marketing language and actual behavior tend to diverge here more than anywhere else in the workflow.
Tool fit. Varies widely. For revision-heavy work such as design-build or fast-track healthcare, this one step can determine which tool gets selected. Test revision handling directly before committing.
Directional savings. No number here on purpose. It depends entirely on whether your chosen tool tracks deltas. Test it on a real revision before you commit.
What it is. Group raw device counts into labor and material assemblies, apply unit costs and labor units, and build priced bid line items.
Manual cycle time. Roughly 2 to 6 hours, depending on assembly complexity and how mature your library is.
What automation changes. Here, AI takeoff alone is not the answer, and any honest vendor will tell you so. The estimating suite still does the heavy lift. AI takeoff feeds clean, classified quantities in — Drawer AI via an Excel export carrying quantities, device properties, and wire lengths — which cuts re-keying but does not touch your assembly logic.
Tool fit. Legacy estimating-suite territory. McCormick, Trimble Accubid, and ConEst IntelliBid own the mature assembly libraries and labor-unit databases. AI takeoff feeds them; it does not replace them. AI takeoff is the input layer, not the output.
Directional savings. 10 to 25% directional, almost all of it from cutting manual re-keying. Verify on your own workflow.
What it is. Push final quantities into the estimating tool, spreadsheet, or bid document, formatted for whoever receives it.
Manual cycle time. Roughly 30 minutes to 2 hours, mostly re-keying overhead when systems do not talk to each other.
What automation changes. Structured exports cut re-entry. Drawer AI exports to Excel and PDF, with the Excel file carrying quantities, device properties, and wire lengths. Be precise about the limit: there is no published API or direct two-way estimating-suite integration. Frame the saving as a clean structured export that reduces re-entry, and expect it to shrink when the receiving system still requires manual re-keying.
Tool fit. Highly tool-dependent. Export format depth varies by vendor, so confirm the formats work for your own stack before counting on the saving.
Directional savings. 30 to 60% when a clean export lands in a system that can consume it; minimal when manual re-keying remains. Verify on your own workflow.
Total manual takeoff time on a device-dense commercial bid runs into the tens of hours. The Starr symbol takeoff alone took nearly 23 hours by hand before Drawer AI. The full bid cycle is larger and swings widely by project, so resist any single universal figure.
The directional picture: when AI takeoff is applied across steps 1 through 6 and feeds clean data into steps 8 and 9, the takeoff portion of the cycle drops substantially. Read that as a range, not a promise. The verified anchor is Starr's 76.1%, and it applies to the takeoff steps — detection plus QA — not the whole bid cycle. Anyone quoting it as a full-cycle number is stretching it.
|
Phase |
Manual (Directional) |
With AI Takeoff + Review |
|
Intake, counting, stitching (Steps 1–3) |
~10–30 hrs |
~3–8 hrs |
|
Classification, mapping, reconciliation (Steps 4–6) |
~3–9 hrs |
~2–5 hrs |
|
Assembly & export (Steps 8–9) |
~2.5–8 hrs |
~2–6 hrs |
|
Starr symbol takeoff (verified) |
22 hrs 55 min |
5 hrs 29 min (76.1% less) |
The more useful way to think about the hours you get back is not 'do more bids' but 'do better bids.' The time freed from clicking goes into assumptions, clarifications, value engineering, and post-award reconciliation — the work that actually moves your win rate and your margin.
Being clear about the ceiling is what separates a tool you can trust from a demo that oversells. Four things stay firmly on the estimator's side of the line:
AI takeoff returns hours to the estimator. What you do with those hours is what changes the shop's win rate.
Nine steps, wildly different automation impact, and one verified anchor: Starr's 76.1% off symbol takeoff. The estimator's role shifts from clicking to judgment, and the hours you get back are the whole point.
The honest test is your own recent commercial bid. Run the nine steps against your manual baseline and see where the time actually moves. Start with Drawer AI's pricing and feature detail at drawer.ai/pricing, or book a demo to see the workflow run on a set you already know cold.

14425 Falcon Head Blvd
Building E, Suite 100,
Austin, TX 78738
Created by Estimators, Powered by AI and Innovation
Copyright © 2026 Drawer AI. All rights reserved.